Almost every comparison of Tehran and Dubai property is useless, and the reason is always the same: somebody quotes a toman price without saying what a toman was worth on the day. In a currency that has lost three quarters of its dollar value in under three years, that is not a rounding problem. It reverses the answer.
So this article does it the other way round. Every Tehran figure below is shown in toman, in dollars and in dirhams, with the exchange rate used and the date of that rate printed next to it.
The number that breaks every comparison
Between the end of 2023 and today the free-market rate went from about 50,500 toman to the dollar to 203,700. That is not inflation in the ordinary sense. It means any price quoted in toman two years ago is describing roughly a quarter of the value the same number describes today.
If you own an apartment in Tehran, this has a strange consequence. You can be genuinely richer in toman and genuinely poorer in dollars, at the same moment, on the same asset. Neither feeling is wrong. They are just measured in different units.
For anyone deciding between keeping capital in Tehran and moving some of it to Dubai, this is the whole question, and it cannot be answered in toman.
One Tehran square metre, in toman and in dollars
Here is the same square metre at four dates, priced both ways.
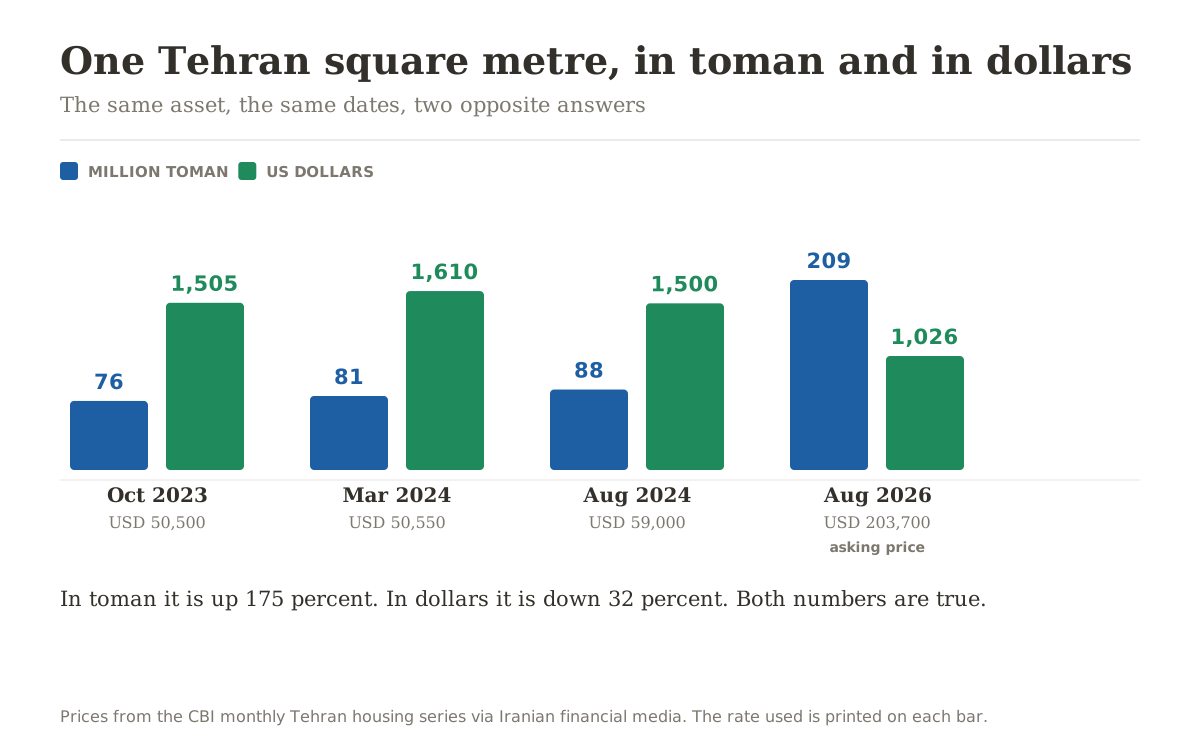
| Date | Toman per sqm | Rate used | In dollars |
|---|---|---|---|
| Oct 2023 | 76,000,000 | 50,500 | $1,505 |
| Mar 2024 | 81,400,000 | 50,550 | $1,610 |
| Aug 2024 | 88,500,000 | 59,000 | $1,500 |
| Aug 2026 | 209,000,000 | 203,700 | $1,026 |
Read the last two columns together. The toman column looks like a market that has almost tripled. The dollar column looks like a market that has lost a third. The apartment did not move. The unit of measurement did.
This is the single most useful thing an Iranian owner can understand about their own asset, and it is why so many people feel that their property has done well and that they are somehow worse off. Both are correct.
One square metre, in three currencies
Now the actual comparison, at one date and one rate, so nothing is hidden.
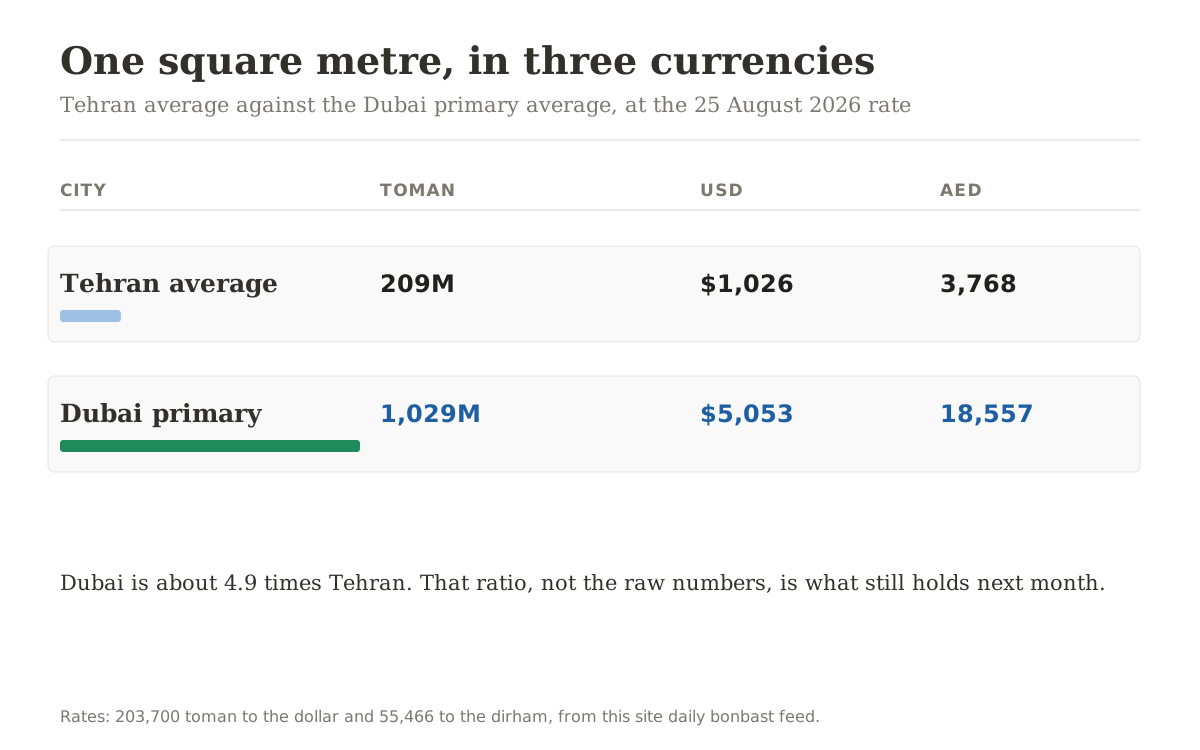
| City | Toman per sqm | USD | AED |
|---|---|---|---|
| Tehran average | 209,000,000 | $1,026 | 3,768 |
| Dubai primary market | 1,029,000,000 | $5,053 | 18,557 |
Dubai costs about 4.9 times Tehran per square metre. That is the honest headline and I am not going to dress it up: Dubai is far more expensive per unit of space, and anyone telling an Iranian buyer otherwise is selling something.
The ratio is the part worth remembering rather than the absolute figures, because the ratio survives the next exchange rate move and the absolute numbers do not.
Where these numbers come from, and what I could not get
I want to be straight about sourcing, because this is the part of a Tehran comparison that is usually hidden.
The Tehran prices come from the Central Bank of Iran's monthly Tehran housing series, which is the proper authority: it measures transacted prices through registered agencies, not asking prices. I could not pull it from the CBI site directly, because that site is behind an image CAPTCHA, so the figures here are the CBI numbers as reported by Iranian financial media, and I have kept only readings I could date confidently.
One important caveat on the most recent figure. The 209 million for August 2026 is an asking price from listing data, not a CBI transacted average. Asking prices in Tehran currently run above transacted prices because the market is in a deep freeze: monthly transactions have been running under 3,000 units against a normal level several times that. So the real transacted figure is probably lower, which would make the dollar decline larger, not smaller.
The exchange rates are the annual closes from a public Iranian rate archive, plus this site's own daily bonbast feed for today's number. Every one is printed on the chart next to the price it converted.
What I could not build is a clean month-by-month series for the last two years, because the secondary reporting mixes Persian calendar years and I would rather show four dates I can stand behind than twenty-four I cannot.
Rent works differently, and it changes the yield completely
This is where most comparisons quietly break, and it is the reason I would not trust a Tehran yield figure that does not explain itself.
Iranian rentals are not a monthly rent. They are a large refundable deposit, رهن, usually combined with a smaller monthly payment, and often taken as رهن کامل with no monthly rent at all. You cannot compare that to a Dubai rent until you convert it.
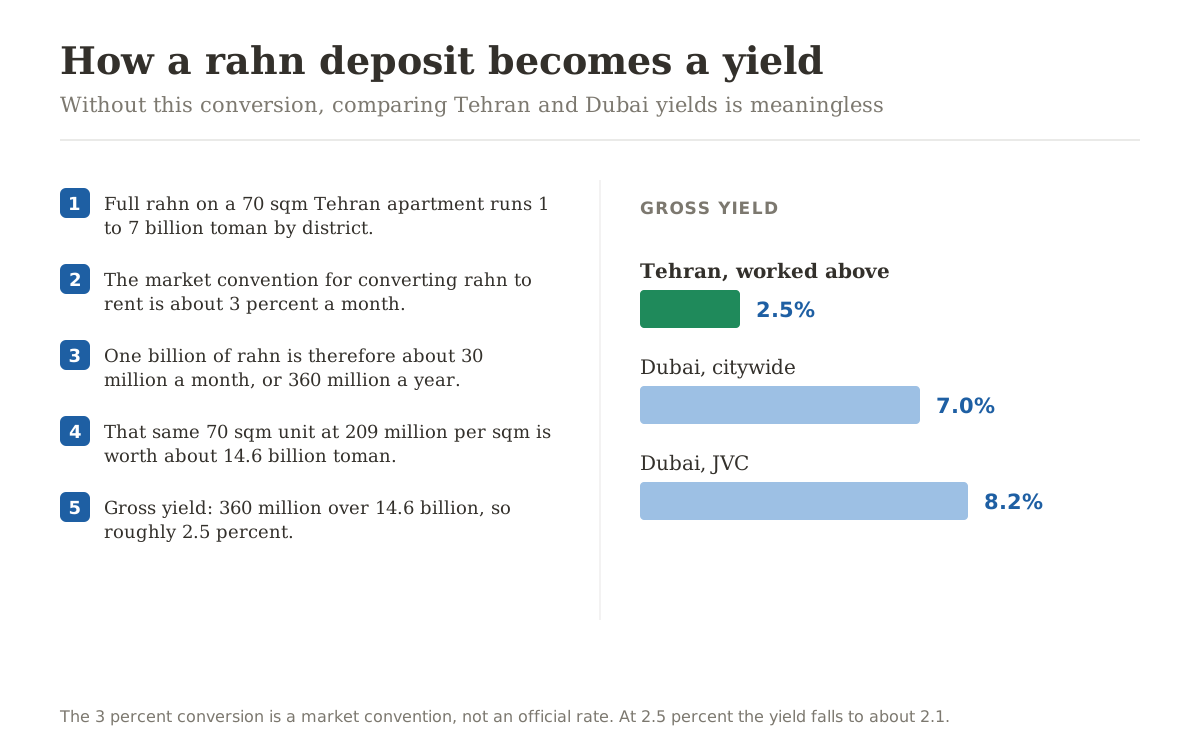
The market convention is that roughly 3 percent of the deposit per month is the equivalent monthly rent. Working it through:
- Full رهن on a 70 square metre Tehran apartment runs about 1 to 7 billion toman depending on the district.
- Take the lower end, 1 billion. At 3 percent a month that is about 30 million toman a month, or 360 million a year.
- That same 70 square metre unit at 209 million per square metre is worth about 14.6 billion toman.
- Gross yield: 360 million over 14.6 billion, roughly 2.5 percent.
Against that, Dubai runs about 7 percent citywide and 8.2 percent in JVC. Even the prime, capital-preservation end of Dubai, City Walk at 5.5 to 6 percent, is more than double Tehran.
Two honest caveats. The 3 percent conversion is a market convention, not an official rate, and at 2.5 percent the Tehran yield falls to about 2.1. And Tehran rents are themselves quoted in toman, so they inflate too. The point is not the decimal place. It is that the gap is roughly three times, and it is structural rather than a moment in the cycle.
Tehran districts and their Dubai equivalents
This is the question I get asked most often, and the useful way to answer it is by position within each city's own price ladder rather than by how a place looks.
| Tehran | Roughly equivalent position in Dubai |
|---|---|
| District 1, Niavaran and Zafaraniyeh | Palm Jumeirah, Emirates Hills |
| District 3, Vanak and Jordan | Downtown Dubai, Business Bay |
| District 2, Saadat Abad and Shahrak-e Gharb | Dubai Marina, JLT |
| District 5, Punak and Sadeghieh | JVC, Arjan |
| District 22, Chitgar | Dubai South, the newer master plans |
| District 4, Tehranpars | Mirdif, Al Warqa |
That table is my own read, not a published mapping, and it maps price position rather than character. A Vanak apartment and a Downtown apartment are nothing like each other to live in. They occupy the same rung of their respective ladders.
One aside that is not a valuation point but is genuinely interesting. Jumeirah Village Circle is laid out as a ring with districts radiating from the centre, and anyone who has looked at a map of Hamedan will recognise the shape: Hamedan's centre is a famous radial plan, six avenues spoking out from the central square. Two cities, ninety years and three thousand kilometres apart, arriving at the same geometry. It tells you nothing about yield. I mention it because once you have seen it you cannot unsee it.
What the ratios say
Strip out the currency entirely and three ratios carry the whole comparison.
- Price per square metre: Dubai is about 4.9 times Tehran.
- Gross rental yield: Dubai is about 2.8 times Tehran, roughly 7 percent against 2.5.
- Currency: the toman has lost about three quarters of its dollar value since the end of 2023. The dirham is pegged to the dollar and has lost none of it.
The first ratio favours Tehran and the second two do not. That is the real trade, and it is why the answer is not the same for everyone. You are paying roughly five times the price per metre to buy an asset that earns nearly three times the income in a currency that does not move against the dollar.
What this does not mean
It does not mean sell in Tehran and buy in Dubai. I am not in a position to tell anyone that and I would be suspicious of anyone who is.
A home you live in is not an investment position, and moving capital out of Iran is a serious, sometimes difficult, sometimes restricted process that has nothing to do with which market has the better yield. Transfer routes, timing and cost can move the arithmetic more than anything in this article. That is a conversation with your own advisers, not with a property consultant.
It also does not mean Tehran property has been a bad asset. Over long periods it has protected Iranian savers from inflation better than almost anything else available to them, and that is exactly what most owners bought it for. Judged as inflation protection in toman it has done its job. Judged as a dollar asset it has not, and those are different questions.
My take
The number I would want an Iranian owner to sit with is the one in the first chart: up 175 percent in toman, down 32 percent in dollars, same apartment, same dates.
If your costs, your life and your children's future are all in toman, the toman number is the one that matters and Tehran has served you. If any part of your future is priced in a currency that is not the toman, and for a growing number of the people I speak to that is now most of it, then the dollar column is the one that describes your actual position.
Dubai is not cheap and this article has not argued that it is. It is 4.9 times the price per square metre. What it offers instead is income at roughly three times the rate, in a currency pegged to the dollar, with a title you can hold as a foreigner and a residency attached to it. Whether that trade is worth it depends on which currency your life is denominated in, and that is a question only you can answer.
If you want this run on your own numbers rather than city averages, send me the district and the size and I will do the conversion both ways with the rate of the day printed on it.
Sources: Tehran prices from the Central Bank of Iran monthly Tehran housing series as reported by Iranian financial media; the August 2026 figure is listing asking-price data and is labelled as such. Exchange rates from a public Iranian rate archive and this site's daily bonbast feed. Dubai price per square foot from Dubai Land Department data for July 2026. Yield calculations are mine, with the conversion assumptions stated. For information only, not financial advice.
Frequently asked questions
At the 25 August 2026 rate, the Tehran average is about 209 million toman per square metre, which is roughly $1,026 or AED 3,768. Dubai's primary market averaged Dh1,724 per square foot in July 2026, which is about AED 18,557 or $5,053 per square metre. Dubai is therefore about 4.9 times Tehran per square metre.
Both, depending on the currency. From October 2023 to August 2026 the price per square metre went from 76 million toman to about 209 million, up 175 percent. Over the same period, converted at the rate of each date, it went from $1,505 to $1,026, down 32 percent. The apartment did not change; the unit of measurement did. This is why many owners feel simultaneously richer and worse off.
Roughly 2.5 percent gross in Tehran against about 7 percent citywide in Dubai, so Dubai is close to three times. The Tehran figure has to be worked out from rahn rather than read off a rent: full rahn on a 70 square metre apartment runs 1 to 7 billion toman, the market converts rahn to rent at about 3 percent a month, and that unit is worth about 14.6 billion toman at current prices. At a 2.5 percent conversion the Tehran yield falls to about 2.1 percent.
Iranian rentals are built on a large refundable deposit called rahn, often taken as rahn kamel with no monthly rent at all, sometimes combined with a smaller monthly payment. You cannot compare that to a Dubai monthly rent until you convert it, and the market convention is that roughly 3 percent of the deposit per month is the equivalent rent. Any Tehran yield figure that does not show this conversion should not be trusted.
By price position rather than character: District 1 (Niavaran, Zafaraniyeh) sits where Palm Jumeirah and Emirates Hills sit; District 3 (Vanak, Jordan) matches Downtown and Business Bay; District 2 (Saadat Abad, Shahrak-e Gharb) matches Dubai Marina and JLT; District 5 (Punak, Sadeghieh) matches JVC and Arjan; District 22 (Chitgar) matches Dubai South and the newer master plans; District 4 (Tehranpars) matches Mirdif and Al Warqa. This is a price-ladder mapping and my own read, not a published equivalence.
The Central Bank of Iran publishes a monthly Tehran housing series based on transacted prices through registered agencies, which is the proper authority. The CBI website itself is behind an image CAPTCHA, so the figures here are the CBI numbers as reported by Iranian financial media, kept only where the date could be confirmed. The August 2026 reading is listing asking-price data rather than a CBI transacted average, and is labelled as such: asking runs above transacted right now because monthly transactions have been under 3,000 units.
Because a toman figure without its exchange rate is not a figure. The free-market rate went from about 50,500 toman to the dollar at the end of 2023 to 203,700 now, so any toman price quoted two years ago describes roughly a quarter of the value the same number describes today. Every Tehran number in this article carries the rate used and the date of that rate, and the ratios are given separately because ratios survive the next currency move and absolute numbers do not.
That is not a question a property consultant should answer for you. A home you live in is not an investment position, and moving capital out of Iran is a serious and sometimes restricted process whose routes, timing and cost can move the arithmetic more than anything in this comparison. What the numbers do say is that if any part of your future is priced in a currency other than the toman, the dollar column is the one describing your real position.
Not judged on what most owners bought it for. Over long periods Tehran property has protected Iranian savers from inflation better than almost anything else available to them, and as toman-denominated inflation protection it has done its job. Judged as a dollar asset it has not: down about 32 percent in dollar terms since October 2023. Those are two different questions and the answer depends on which currency your costs are in.
Because it tells you how much to trust the price. Monthly Tehran transactions have been running under 3,000 units against a normal level several times that, which is a deep freeze. In a frozen market asking prices drift above what anyone actually pays, so the current 209 million per square metre figure is likely above the true transacted level. If so, the dollar decline in this article is understated rather than overstated.