A map of GDP per capita across the Middle East and North Africa has been circulating this month. It puts Qatar first at $72,500 a head, Israel second at $60,300, and the UAE third at $50,300. At the other end sit Afghanistan at $400 and Yemen at $600. The figures are credited to the World Bank Group.
It is a good chart and the ranking is not in dispute. What I want to do is take it apart, because clients send me things like this and ask what it means for buying property, and the honest answer is that on its own it means very little. GDP per capita is a national average, and you are not buying a national average. You are buying one asset, in one city, from which you want rent and a resale.
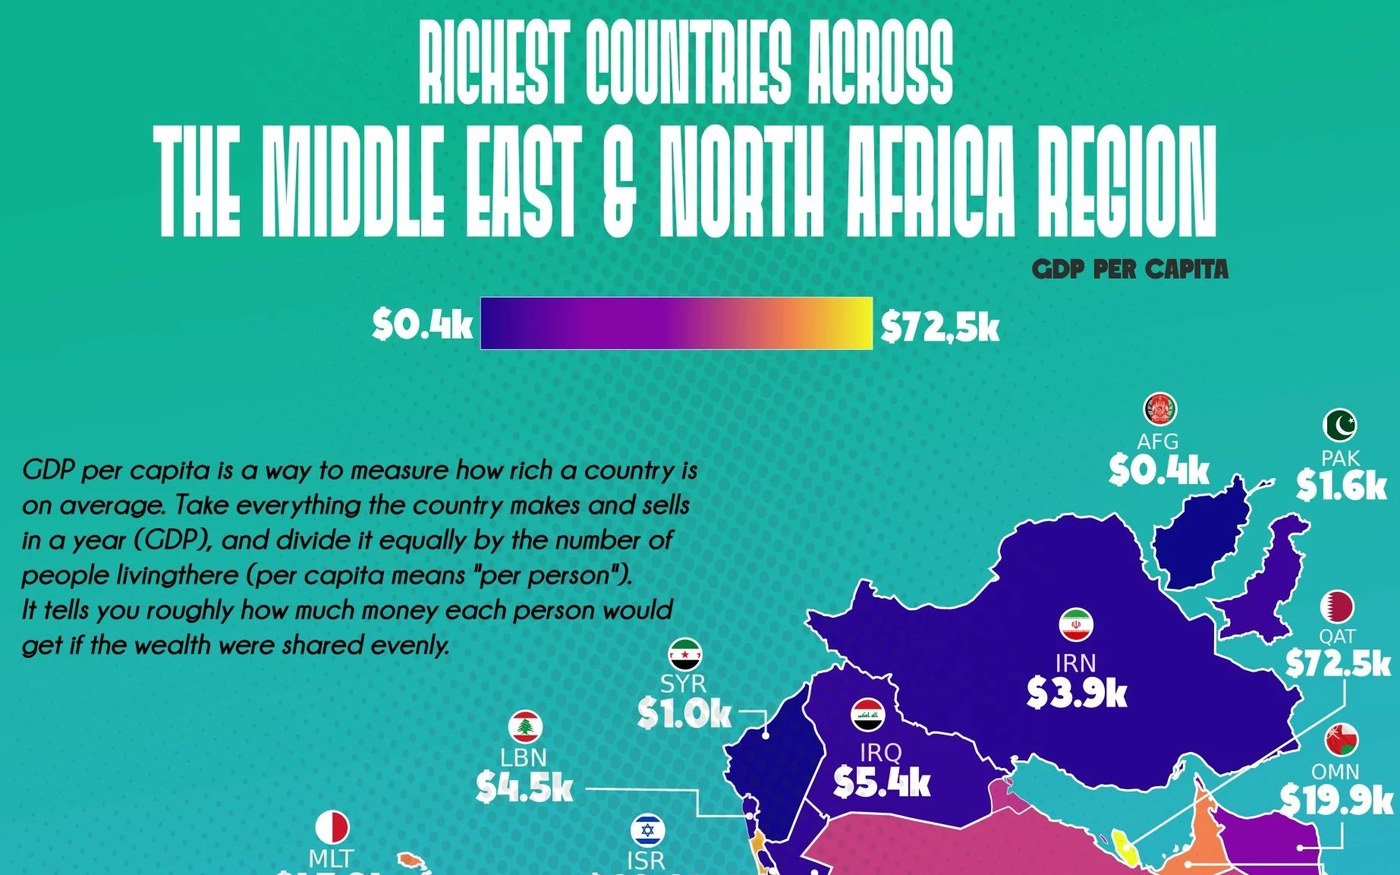
What the map actually shows
Twenty economies, ranked, with a spread of nearly two hundred to one from top to bottom.
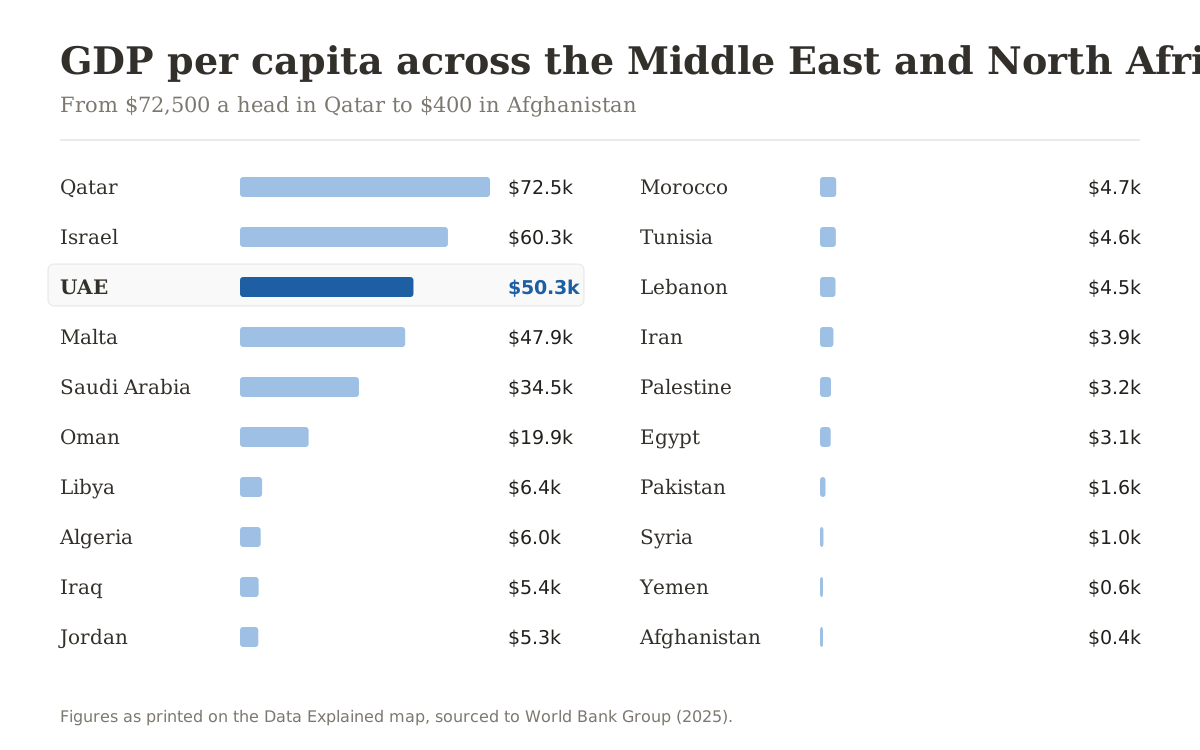
Three things stand out. The top six are separated from everyone else by an enormous gap: below Oman at $19,900 the next country down is Libya at $6,400, so there is essentially nothing in the middle of this region. Second, the gap is not about geography, since Libya and Algeria hold plenty of hydrocarbons and sit near the bottom. Third, the top of the table is small: Qatar, Israel, the UAE, Malta, Saudi Arabia and Oman between them hold a fraction of the region's population.
The two countries the map leaves out
Before reading anything into a ranking, check what is missing from it.
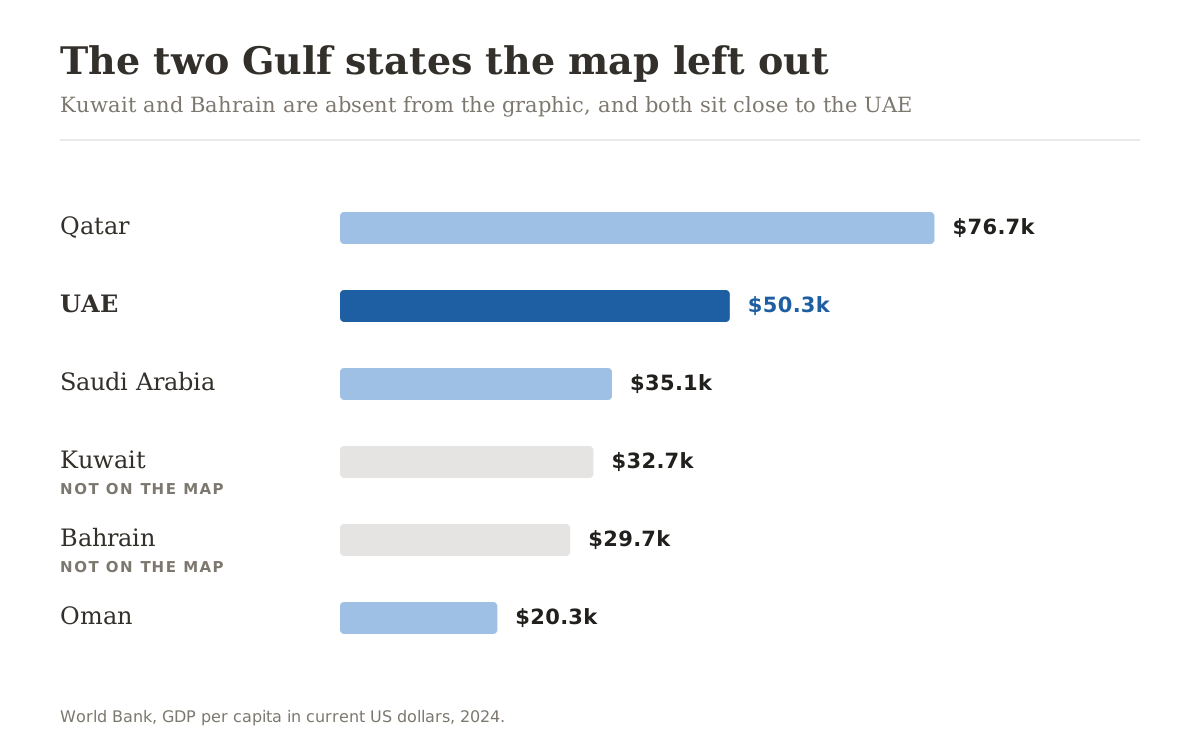
Kuwait and Bahrain are not on the graphic at all. On World Bank 2024 figures Kuwait is at $32,700 and Bahrain at $29,700, which would place both between Saudi Arabia and Oman. That is not a small omission in a chart about Gulf wealth, and it is a useful reminder that a shared graphic is a summary of a dataset, not the dataset.
The vintages differ slightly too. The map has Qatar at $72,500; the World Bank's 2024 current-dollar figure is $76,700. Neither is wrong, they are different years and revisions of the same series. If a number is going to inform a purchase, go back to the source series rather than the picture of it.
Why per-head income is a weak guide to a property market
Here is the structural problem with using this map to pick a market.
GDP per capita is total output divided by population. Both halves of that fraction can move for reasons that have nothing to do with whether a flat will let.
- A small population divided into a large hydrocarbon income produces a very high number without producing a deep property market. Qatar's per-head figure is roughly 44 percent above the UAE's; its total economy is well under half the size.
- A large working expatriate population pulls the average down while creating exactly the demand a landlord wants. The people dragging the UAE's per-head figure below Qatar's are, in property terms, tenants.
- Income says nothing about whether you are allowed to own anything. Which brings me to the chart that actually matters.
The table a foreign buyer should be reading
Take the same countries and add the two columns a buyer cares about: can you own, and does owning get you residency.
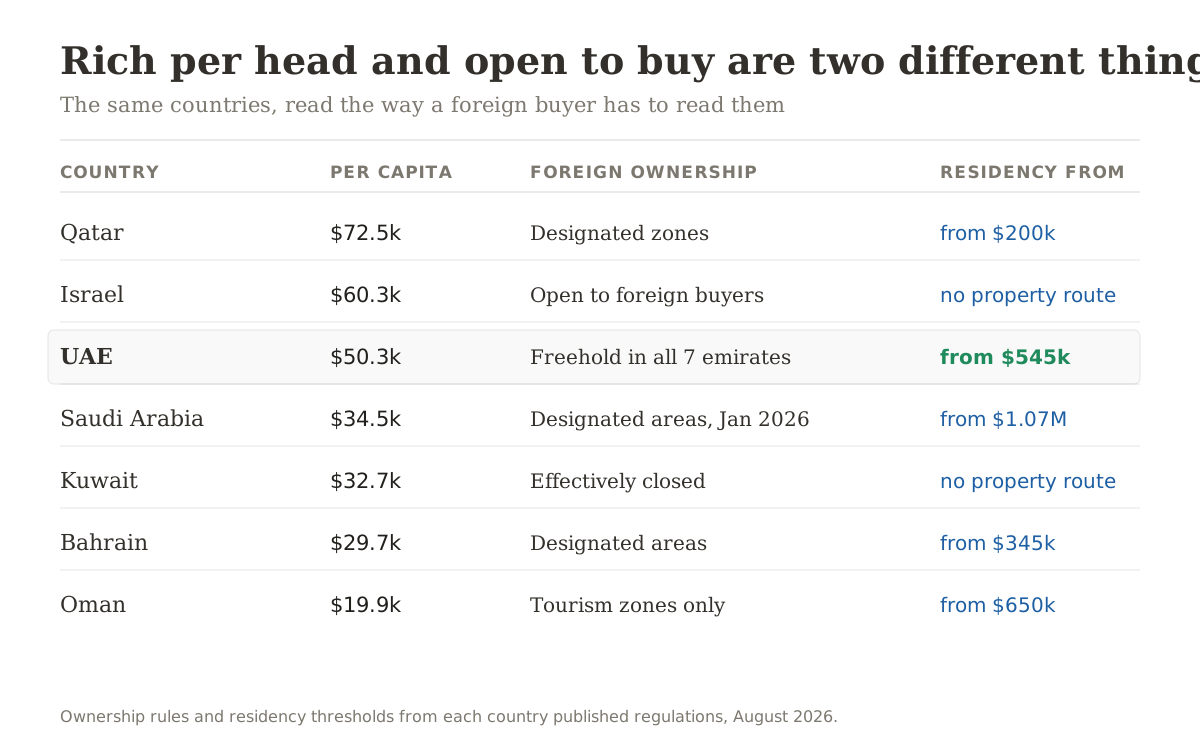
Read that against the first chart and the ranking rearranges itself.
Kuwait is the fourth richest Gulf state per head and is effectively closed to foreign buyers. Israel is second on the whole map and has no property-linked residency route at all. Saudi Arabia only opened designated areas to non-resident ownership in January 2026, so it has no track record yet for a foreign buyer to price against. Oman restricts foreign freehold largely to integrated tourism complexes.
Qatar is genuinely open and its entry threshold is lower than the UAE's: $200,000 buys temporary residency there, against roughly $545,000 for the UAE's ten year Golden Visa. If the only question were the price of the door, Qatar wins.
It is not the only question. The door is cheap in several of these markets. What you should be asking is what happens after you walk through it: how many buyers exist when you want to sell, how many tenants when you want to let, and whether a bank will lend against the asset.
What the UAE has that its per-head number does not show
This is where the UAE case sits, and it is not a case about being the richest.
The economy grew 6.2 percent in 2025 to AED 1.9 trillion, roughly $517 billion. Non-oil activity accounted for AED 1.5 trillion of that and grew 6.8 percent. In the first quarter of 2025 non-oil sectors were 77.3 percent of GDP. Within that, construction grew 11.1 percent, financial and insurance activity 10.4 percent, and real estate 7.9 percent. That is an economy whose growth is no longer coming from the barrel, which is the whole point of the diversification programme and the reason I treat the per-head ranking as the least interesting number on the map.
Then the denominator, which is the part people read as a weakness. Dubai's population passed 4.5 million by the end of 2025, having added more than 200,000 residents in twelve months, growth of around 7.5 percent. Every one of those people needs somewhere to live. A market that adds a city's worth of tenants every few years is a different proposition from one with a very high income spread across three million people.
And the market itself is liquid. July 2026 alone did 13,872 sales worth Dh34.5 billion at an average of Dh1,680 per square foot, with mortgage lending up 55 percent on the month. I went through that month in detail in the July 2026 market update. Liquidity is what you are actually buying when you choose a market: it is the difference between an asset with a price and an asset with a bid.
Where I would be careful
I am not going to end this by telling you everything is up and to the right, because it is not.
Volume in July was down 31.6 percent against July 2025, a comparison made against a period before this year's regional tension. Villa transaction value was down 56.4 percent year on year against 27.6 percent for apartments, so the top of the market has been slower to recover. And a large handover wave is landing through 2026 in the mid market apartment districts, which is a genuine headwind for rent growth in the areas that took the most speculative launches.
None of that changes the structural read. It does change which street you buy on, which is a conversation about a specific building rather than a map of a region.
What I take from the map
The chart is a good answer to the question it was asked. It ranks average income. It does not rank markets, and nobody drawing it claimed it did.
If you are picking somewhere to own an asset, the number I would put first is not income per head. It is whether the economy is still growing without oil, whether the population is growing, whether a foreigner can hold the title, and whether anybody will be there to buy it from you. On those four the UAE is not third. It is the one market in this region that keeps rewriting its own rules to stay open: freehold across all seven emirates, a residency programme tied to the asset, published transaction data anyone can audit, and a regulator that has repeatedly tightened escrow, valuation and lending rules rather than loosened them.
That steadiness is worth more to me than four hundred dollars a week of extra national average income.
If you want to see how those numbers land on one specific building rather than a whole region, tell me what you are looking at and I will send you the transaction history and the yield on it.
Frequently asked questions
Qatar. The map puts it at $72,500 a head, ahead of Israel at $60,300 and the UAE at $50,300. On the World Bank's 2024 current-dollar series Qatar is higher still at $76,700. The ranking measures average income per person, not the size or openness of the economy.
Because GDP per capita divides output by population. The UAE's economy reached about $517 billion in 2025, well over double Qatar's, but it is spread across a far larger population. The residents who pull the average down are the same people who rent apartments, which is why a landlord should read the denominator as demand rather than as weakness.
The graphic simply leaves both out; no reason is given. On World Bank 2024 figures Kuwait is at $32,700 and Bahrain at $29,700, which would place both between Saudi Arabia and Oman. It is worth checking any shared chart against the underlying series before drawing conclusions from it.
The UAE allows freehold ownership in designated areas across all seven emirates. Qatar allows it in designated zones, Bahrain in designated areas, and Oman largely within integrated tourism complexes. Saudi Arabia opened designated areas to non-resident ownership from January 2026. Kuwait remains effectively closed to non-Arab foreign buyers.
No. Qatar grants temporary residency from about $200,000 and Bahrain's golden residency starts at about $345,000, both below the roughly $545,000 of property that qualifies for the UAE's ten year Golden Visa. The threshold is the least useful comparison; what separates these markets is transaction volume, tenant depth and whether a bank will lend against the asset.
No. Rental yield and capital growth come from the balance of supply and demand in a specific district, from population growth, and from how easily an asset can be sold. A high national average built on hydrocarbon income and a small population can sit alongside a thin property market with few buyers.