It covers the whole city, not one developer's portfolio
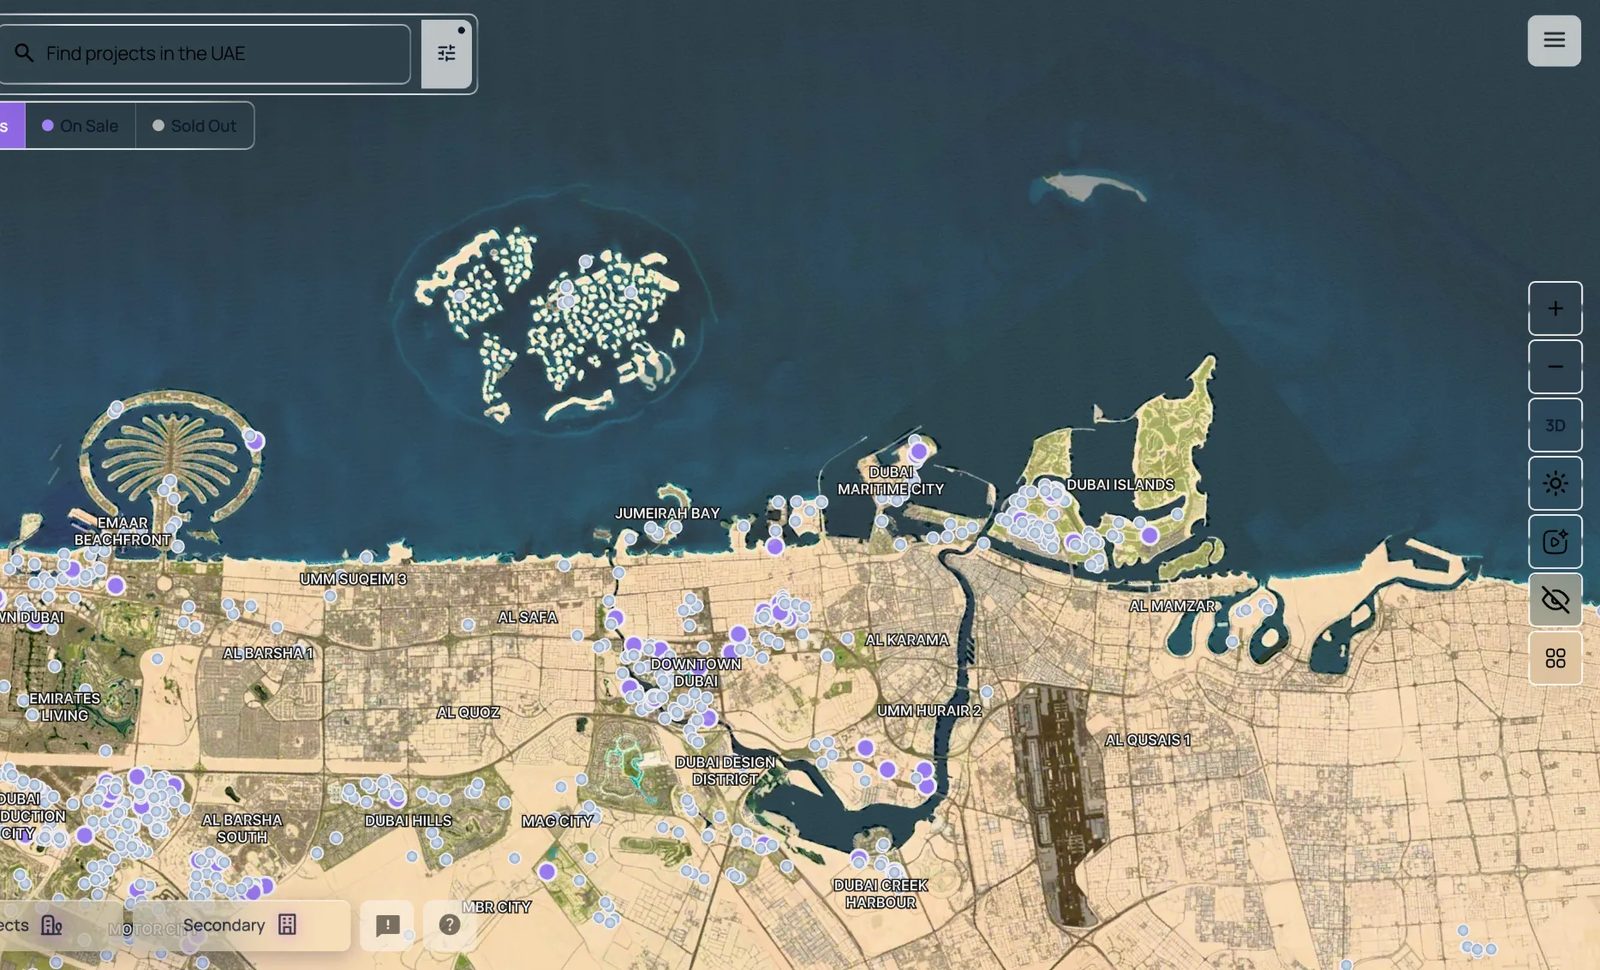
This is the part that matters. A developer's own map shows you a developer's own towers on an empty city. A portal map shows you listings, not projects. This one plots 1,081 projects across the UAE at the same time, with on-sale and sold-out in different colours, so you can read supply density in a community before you say a word about it to a client.
Every project in one list, with filters that matter
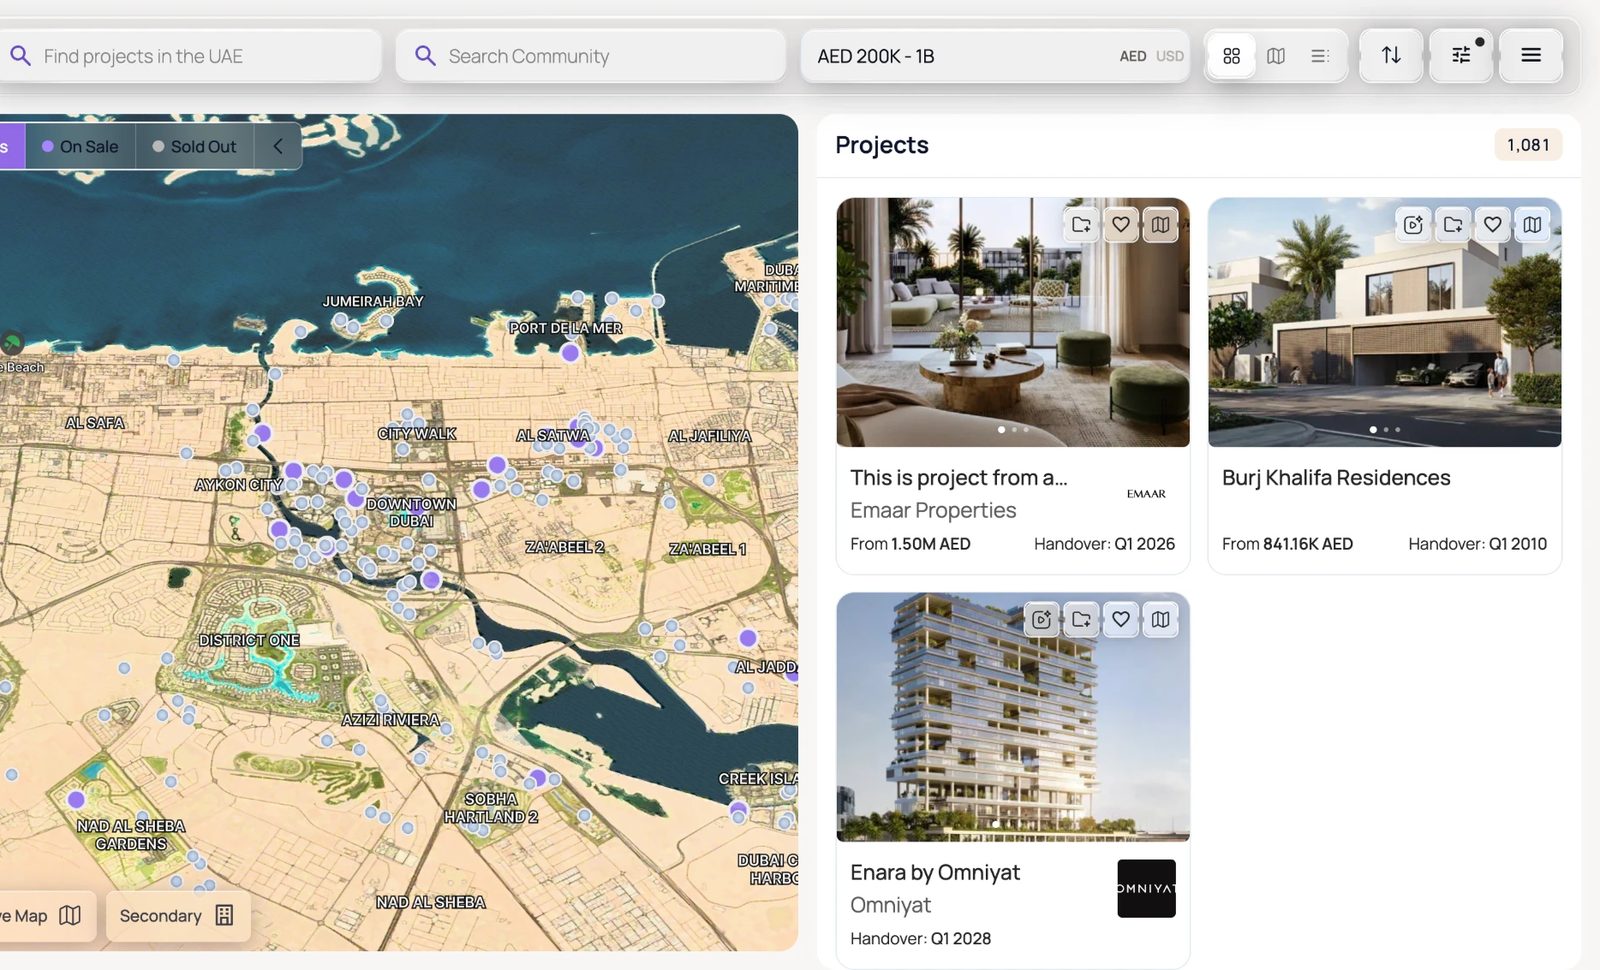
The filter set is better than it first looks. Property type, sales status down to Announcement and Presale, and payment distribution: 20/80, 30/70, 40/60, 50/50, 60/40, 70/30. Filtering by the shape of the payment plan is something the portals do not offer, and it is usually the first real question a buyer asks.
The buildings are modelled, not drawn
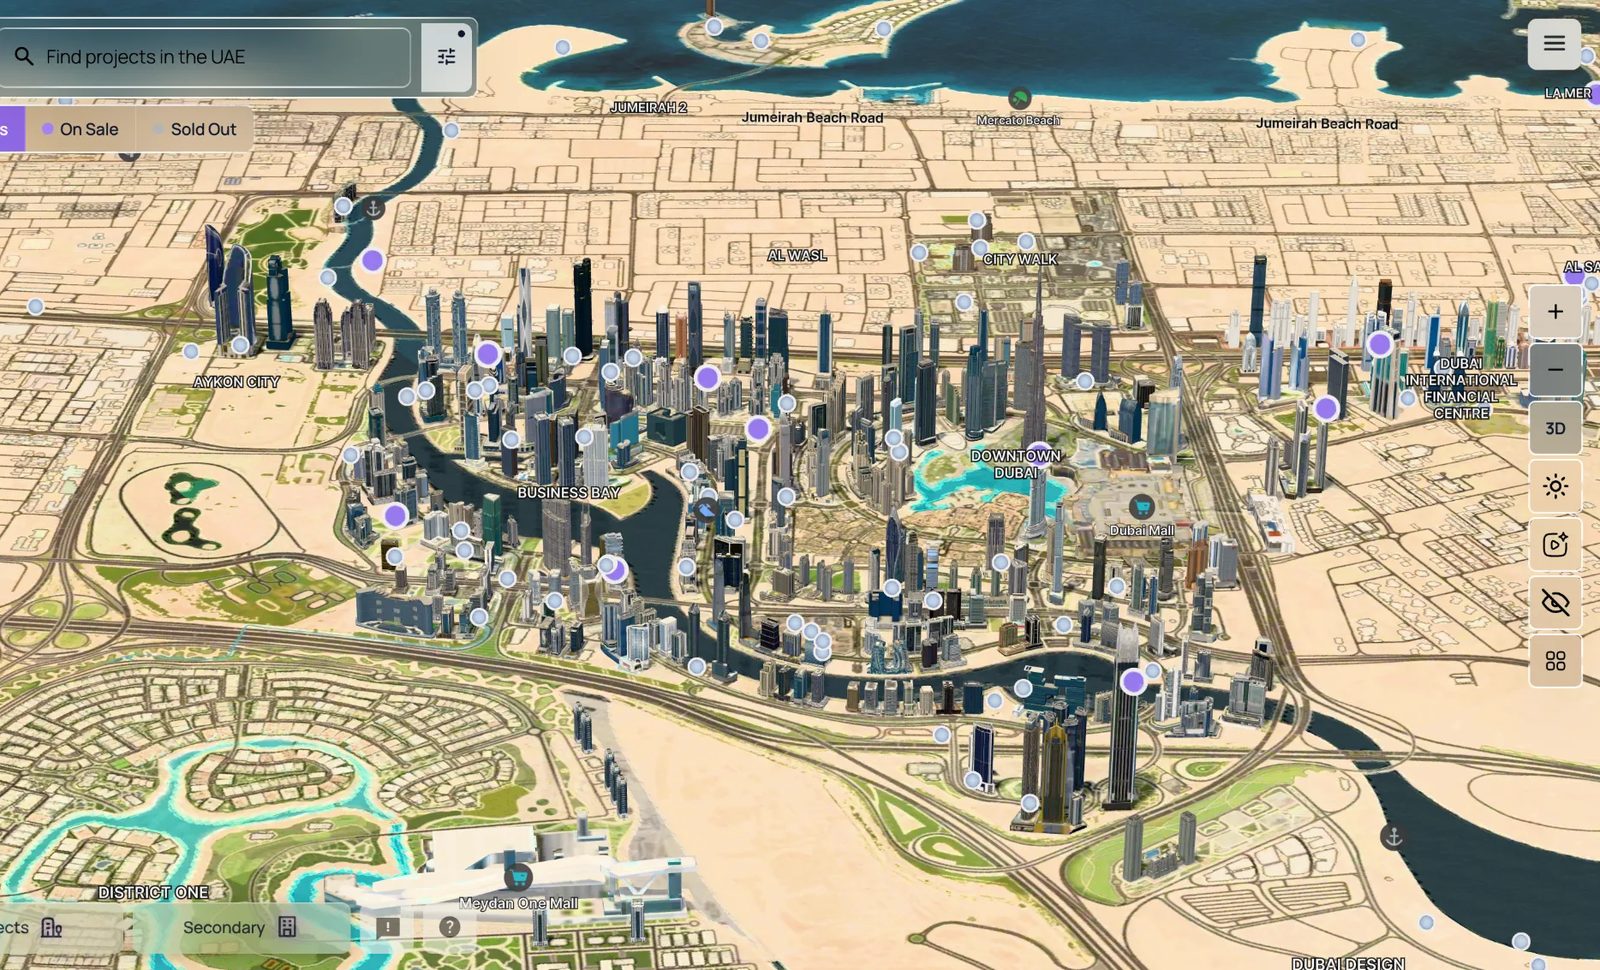
Tilt into 3D and the city comes up as real massing. Most of the towers you would name are there, in the right place and roughly the right shape, which is what makes the next few features worth anything.
Flat view for the plot, not the skyline
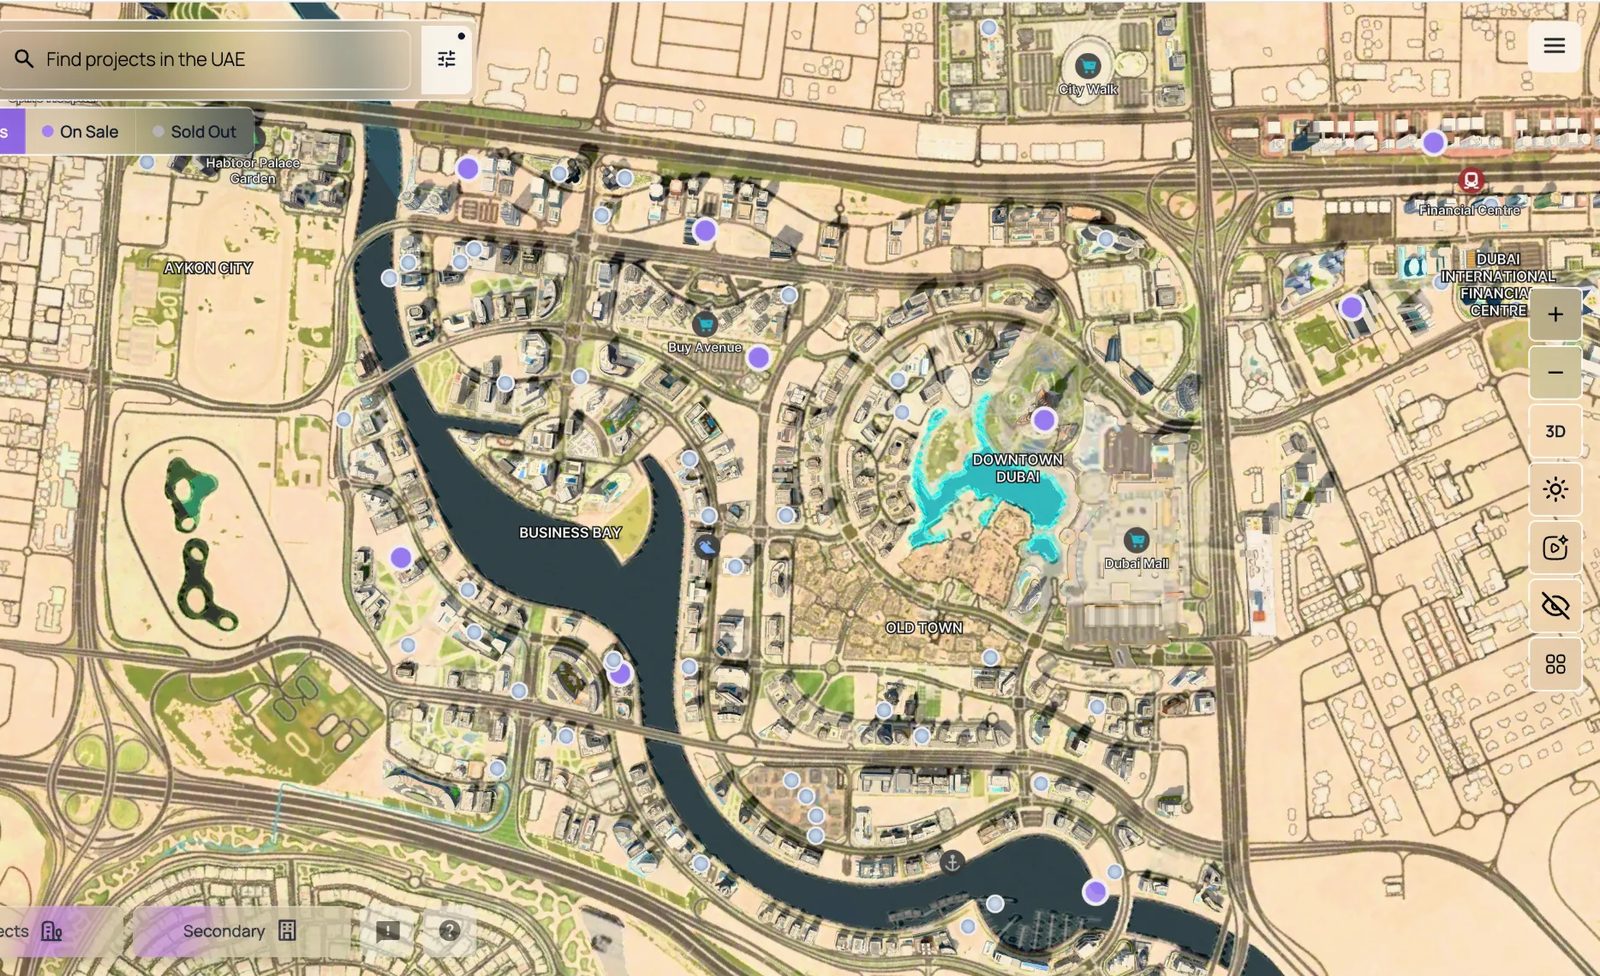
Drop back to the top-down and you get plot lines, road hierarchy and canal frontage. This is the view for explaining why one plot carries a premium over the one directly behind it.
If you want access to the map yourself, click here and it opens straight into the city.
Shadows at any hour, in any month
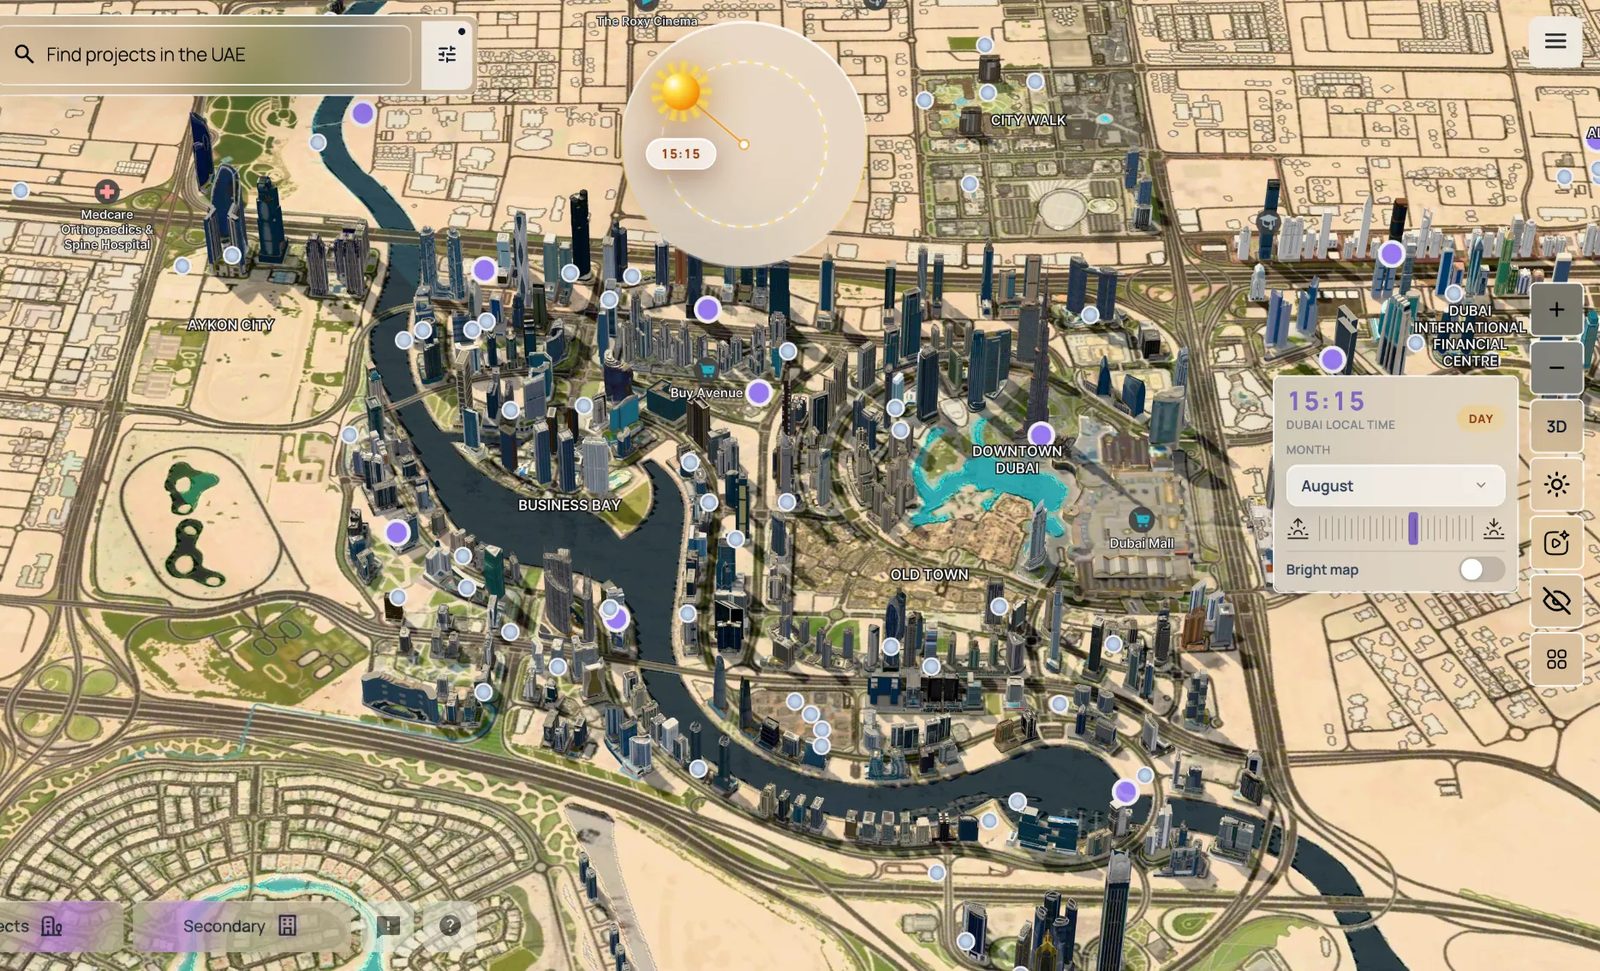
There is a sun control with Dubai local time and a month picker. Drag the slider and the shadows move across the buildings. For a unit facing another tower, this answers the afternoon-light question in about ten seconds, and that is a question clients ask constantly that almost nobody can answer with evidence.
Prices on the map, all at once
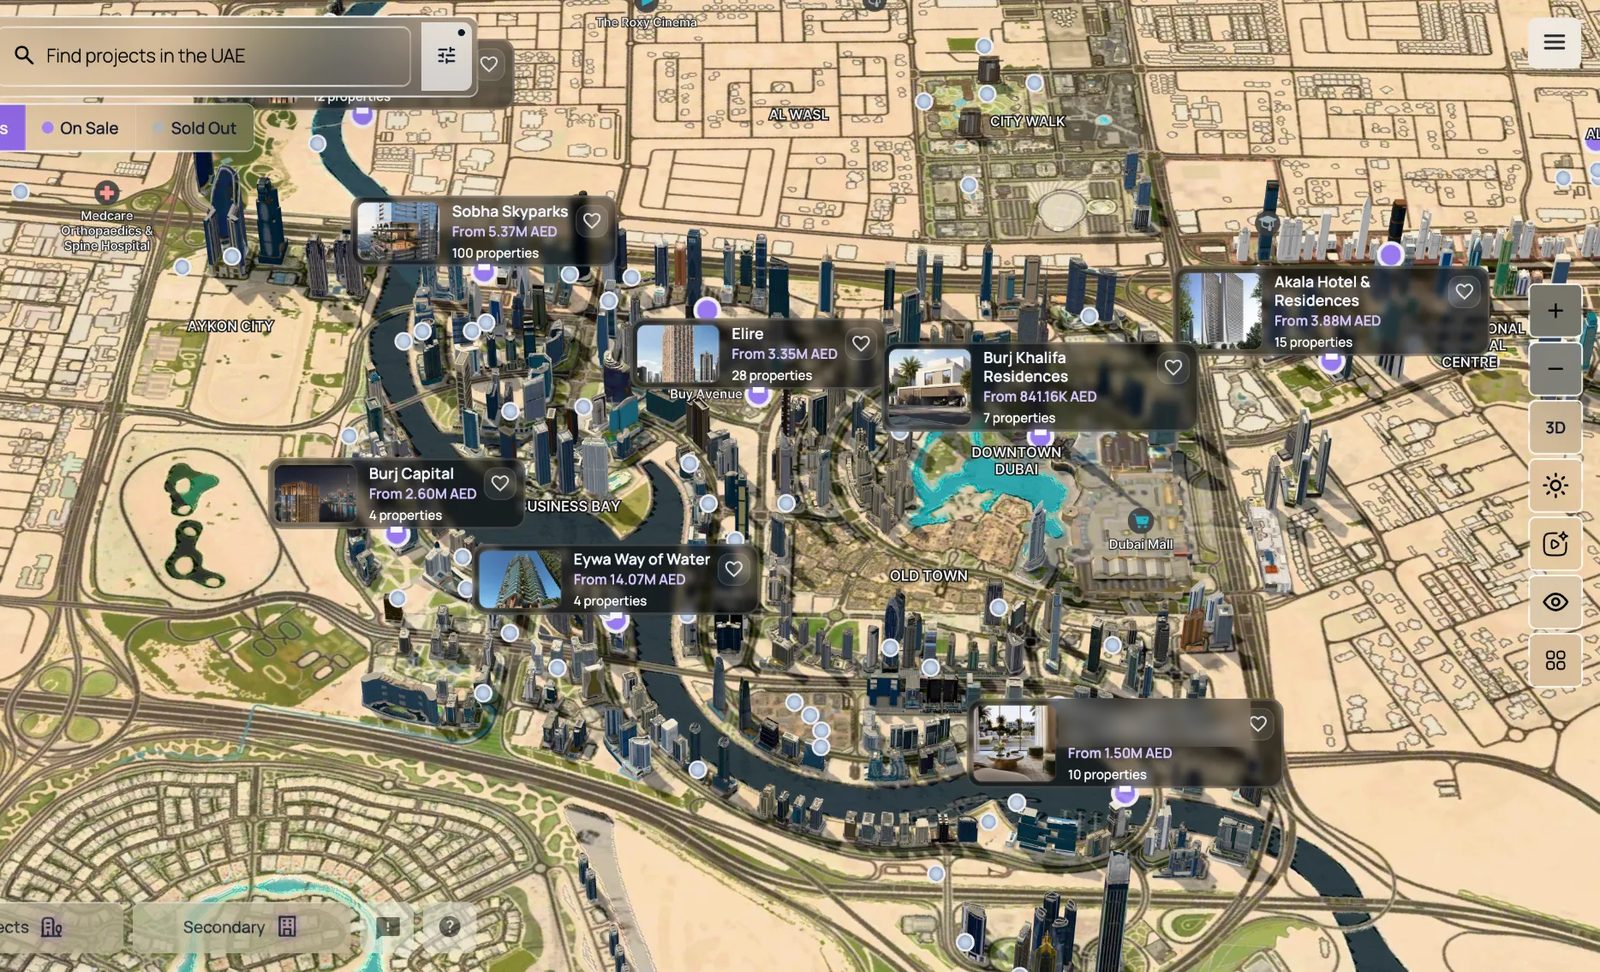
Turn the labels on and every project in view carries its name, entry price and unit count. It is the fastest read of what a district actually costs that I have found.
Street level, and what is around the building
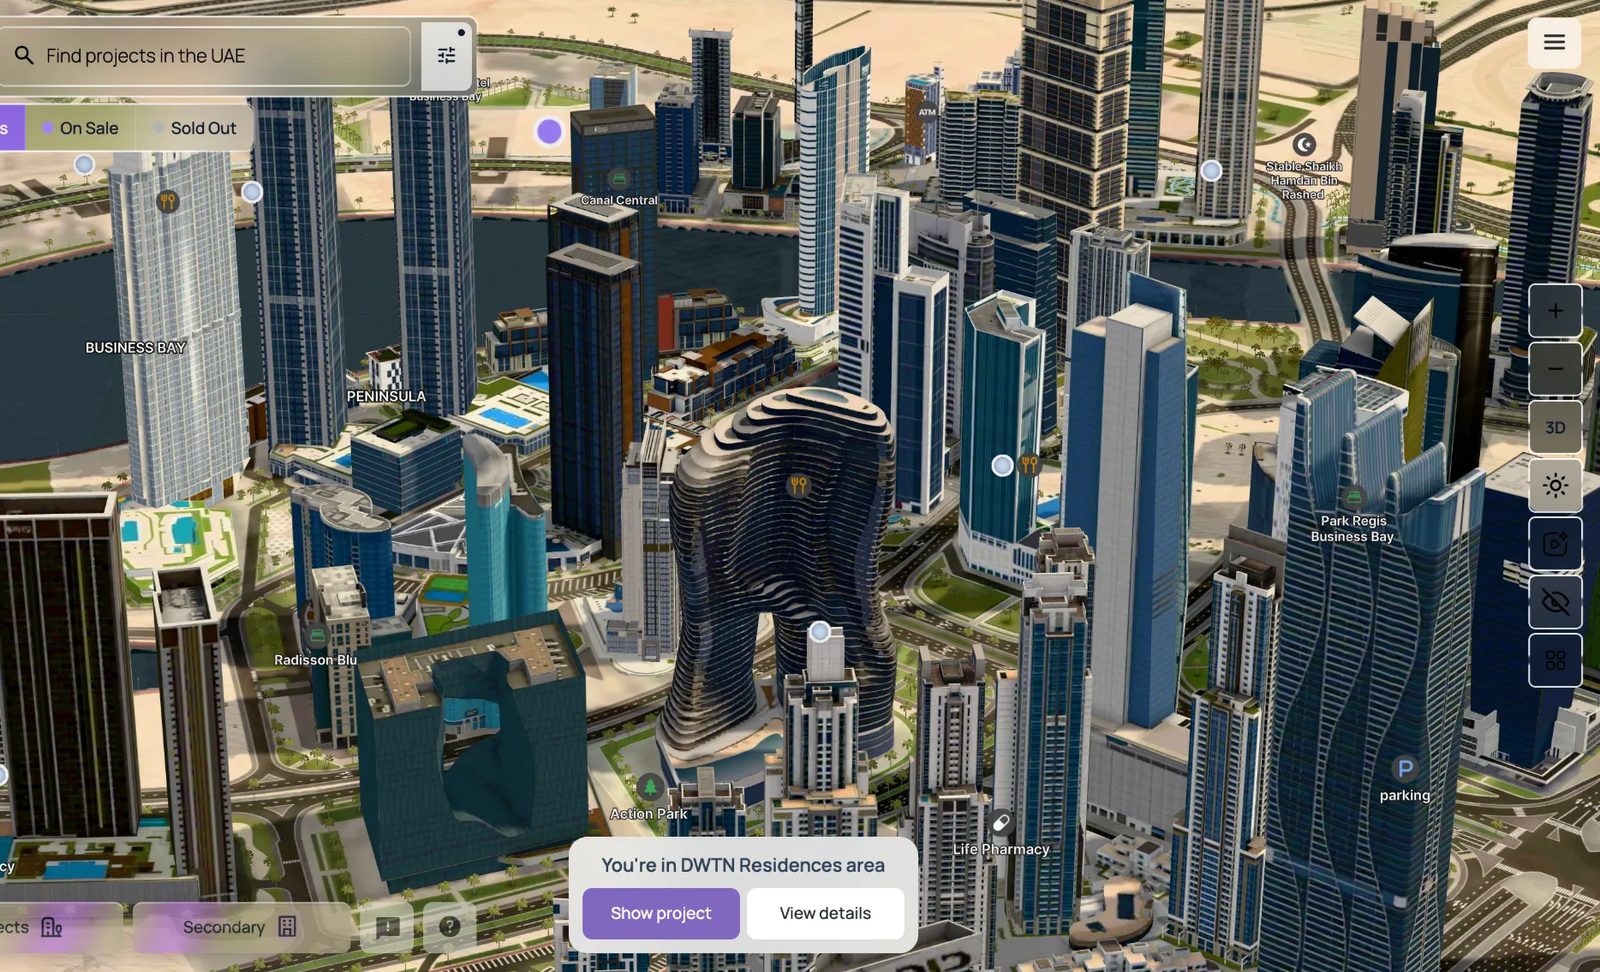
Go close enough and you are among the towers at eye level, with pharmacies, parking, restaurants and stations marked around them. It also tells you which project you are currently standing inside.
Record a flythrough and export it
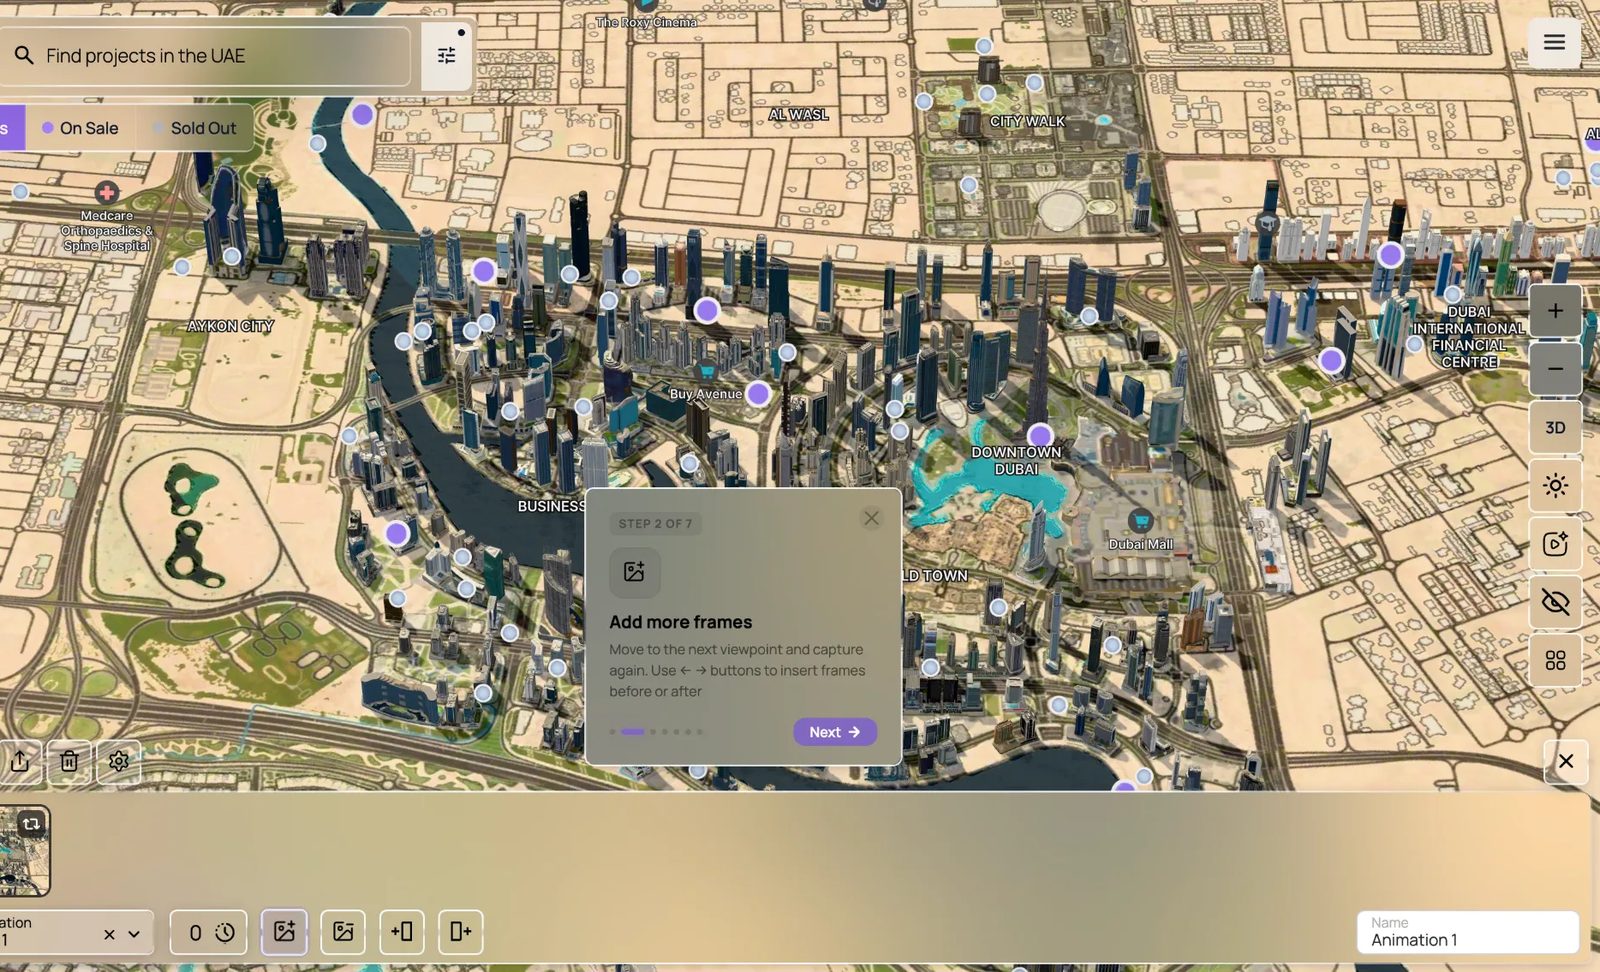
Set a viewpoint and capture a frame. Move somewhere else and capture again. The tool builds the camera path between your frames and exports the result as video, free.
For an agent this is the whole point. A flythrough of a tower in its real surroundings, with real neighbours and real shadows, without hiring a 3D artist and without waiting for a developer to release a marketing pack that only shows their own building on an empty plot.
Worth the time?
For two things, yes. The payment-plan filter answers a question buyers actually ask, and the export gives you content nobody else in your feed has. The rest is context you would otherwise be describing in words.
One caution: the project data is only as current as whoever maintains it, so treat prices and handover dates as a starting point and confirm them before they reach a client. That applies to every map, this one included.
Frequently asked questions
1,081 projects across the UAE at the time of writing, from every developer rather than one.
Yes. Payment distribution filters cover 20/80, 30/70, 40/60, 50/50, 60/40 and 70/30.
Yes. A sun control set to Dubai local time with a month selector moves shadows across the modelled buildings.
Yes, free. You capture viewpoints as frames and the tool builds the camera move between them, then exports video.
It leads with projects but carries a secondary-market layer alongside them.
Treat them as a starting point. Any aggregated map is only as current as whoever maintains it, so confirm price and handover before quoting a client.